
There are thousands of stocks listed on multiple stock exchanges all around the globe and it can be a daunting task to pick a single stock and wish that it would give you the desired return on investment(ROI). For example, the S&P 500 (Standard and Poor’s 500) is an index that is comprised of 500 large companies, and to pick a stock only because you heard an analyst thinks it is set to offer good returns, is the first mistake to investment. Here’s a list of actions for a novice getting ready to make a buck in the stock market:
- Skim through the list of companies listed on the stock market index
- Identify the common names you may have heard or companies whose services you have been using e.g. Netflix.
- Ask yourself if you enjoy the services offered by this company and whether you would like to continue using their service in future.
- If your answer is NO, then you clearly do not have any faith in this company, but if your answer is YES, your next step is to analyse the company’s financials – Never invest in a company you do not believe in or do not like.
- For companies you have no experience with, but have a good impression, look up the company’s website and it’s business operations. If it attracts you, start analyzing!
Most of us today are familiar with the services offered by Netflix and how we often claim to binge watch entire shows during weekends. While we have spent several hours being hooked to the television, let’s begin with our first part in understanding the fundamentals for NETFLIX.
Netflix(NFLX) is listed on the NASDAQ index which comprises over 3000 stocks. In the last 6 months this stock has shown tremendous growth and it’s price has nearly doubled in a short span. This kind of upswing in the market price can make an investor eager to invest in this stock which is on the minds of every analyst on every major business news channel. However, it is far more important to understand the company’s financials before making any such decision. This type of analysis is referred to as Fundamental Analysis.
The best way to obtain a company’s financial report is to directly search for the annual report on the NASDAQ or you could also obtain one from the company’s website. The purpose of this post is only to educate you about fundamental analysis, without trying to make any market calls. Therefore, I am using the annual report ending December, 2017.
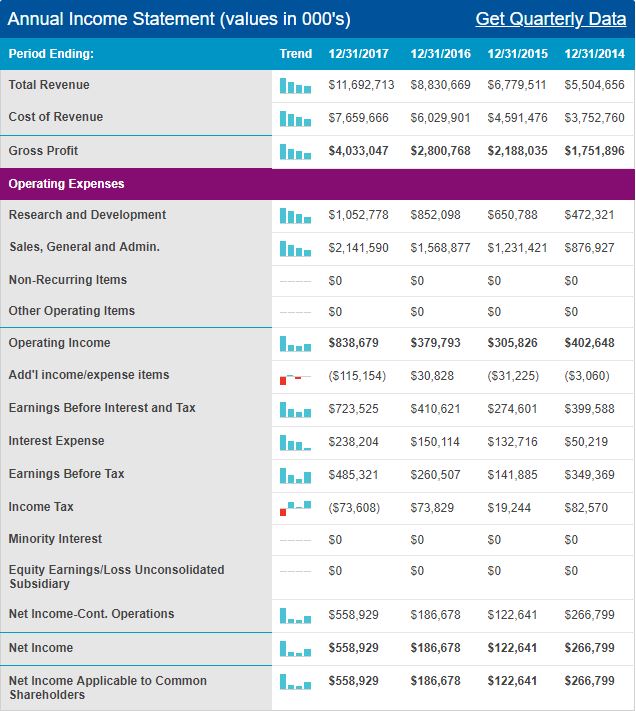
The starting point is by looking at the income statement or the profit and loss statement for the company. This will provide a basic idea of how the company has been performing in terms of sales and revenue over time.
As seen in the above data, the Total Revenue between 2016 and 2017 increased by 32%. Simply looking at this number gives an investor a clear idea that the company was able to sell its products and services during this year. Netflix, being a subscription based business, was able to acquire new customers and subscriptions, including retaining the existing customers, thereby showing an increase in it’s revenue. Adding more content, producing various movies and shows only added to the increasing interest among customers. Understanding a company’s services and it’s business model is key to picking the right stock.
A negative sales/revenue growth does not always mean you would reject the company outright, as there can be several factors affecting this which we will cover during this series.
The Gross Profit tells you the amount in dollars that Netflix made after deducting the cost to sell it’s product and services. The gross profit growth here is 44%.
Operating Expenses comprise of various kinds of expenses associated with the company’s day-to-day operations. This includes payroll, benefits, taxes, travel and even repairs. As you can see Netflix increased it’s expenses on research and development over the years to enhance their services which has effectively translated to their stunning growth.
Operating Income measures the amount of profit realized from a business’ operations, after deducting operating expenses, and cost of revenue. Operating income takes a company’s gross income, and subtracts all operating expenses.
Net Income is the Profit calculated after subtracting the cost of revenue, operating expenses, interest, tax and other expenses from the total revenue. This is the total profit and as we can see the profit growth is close to 200%! After looking at these impressive numbers it was certain that the company had potential to sustain market fluctuations and grow in the future.
With this we have learned that the following financials are strong indicators of the stock price moving upward :
1. Consistent growth in Sales/Revenue
2. Consistent growth in Net Profit/Income
Now that you are familiar with reading the profit and loss statement, the next step is to familiarize yourself with the balance sheet. While the income statement can provide useful insights, an investor cannot get a complete picture without understanding the balance sheet and it’s components. In my next post, I will cover the different aspects of the balance sheet and which indicators must an investor look for to make a sound decision.
Be Frugal, Be Smart, Be Rich!
PS: Your feedback during this series is highly appreciated providing me with a clear understanding about the topics I should cover along the way.
Next in this Series ⇒ Fundamental Analysis II
Related Articles:
Stock Market Investment – Introduction
Stock Market Investing – Understanding Indices & Ratios

Pingback: Stock Market Investment – Fundamental Analysis II – The Frugal Investor
Pingback: Stock Market Investing – Understanding Indices & Ratios – The Frugal Investor
Pingback: Start investing with Mutual Funds – Your guide to Diversification – The Frugal Investor
Pingback: 4 ways to harbor your wealth from the next Recession – The Frugal Investor
Pingback: The Asterisk with Stock Dividends – The Frugal Investor
Pingback: Using Dollar Cost Averaging for your Investments – The Frugal Investor
Pingback: Hello, I’m here to Buyback your Stock! – The Frugal Investor
Pingback: Stock Market Investing – Introduction – The Frugal Investor
Nice one!
LikeLike
Thank you! Appreciate the feedback 😊
LikeLike
Pingback: Stock Market Investing – Understanding Indices & Ratios – Seeking My Utopia
Pingback: Stock Market Investment – Fundamental Analysis II – Seeking My Utopia
Pingback: Start investing with Mutual Funds – Your guide to Diversification – Seeking My Utopia
Pingback: 4 ways to harbor your wealth from the next Recession – Seeking My Utopia
Pingback: The Asterisk with Stock Dividends – Seeking My Utopia
Pingback: Using Dollar Cost Averaging for your Investments – Seeking My Utopia
Pingback: Hello, I’m here to Buyback your Stock! – Seeking My Utopia
Pingback: Your Completely FREE Beginners Guide to Stock Market Investing – Seeking My Utopia
Reblogged this on .;..
LikeLiked by 1 person
Pingback: Learn how to analyze a Stocks Fundamentals before Investing - Info Jedi